Assessing soil characteristics of the city to help in understanding flood risks and develop flood models that will help in flood mitigation plans
Since its kick off in 2015, the Ramani Huria Project has collected numerous amount of data to help mitigating and planning for flooding in Dar es Salaam. Data collected include historical flood extents data, drainage data, infrastructure – buildings, roads, drains, etc. We also conducted flood risk identification in more than 200 subwards of Dar es Salaam and mapped hyper-local boundaries of the city, famously and informally known as “shina boundaries”.
Having all these data was not sufficient to produce a flood model of the city. There was one missing component in the data which is soil characteristics of the city to help in geomorphological assessment. The existing soil data was too generalized for the whole country which would be of help when trying to understand the nature of soil of the city.
Ramani Huria partnered with JBA Consulting (specialized in understanding geomorphological features) all funded by the World Bank and worked on developing a surface soil dataset that will be used for geomorphological assessment and soil characteristics of Dar es Salaam in comparison with future flood risk studies in the region. Soil and/or sediments were sampled from Dar es Salaam and nearby districts that border the city because most of the sediments that flow to the city are from the upper catchment areas which are not likely to be within the city. In order to get a complete dataset of sediments form, these areas needed to be examined too.
Methodology
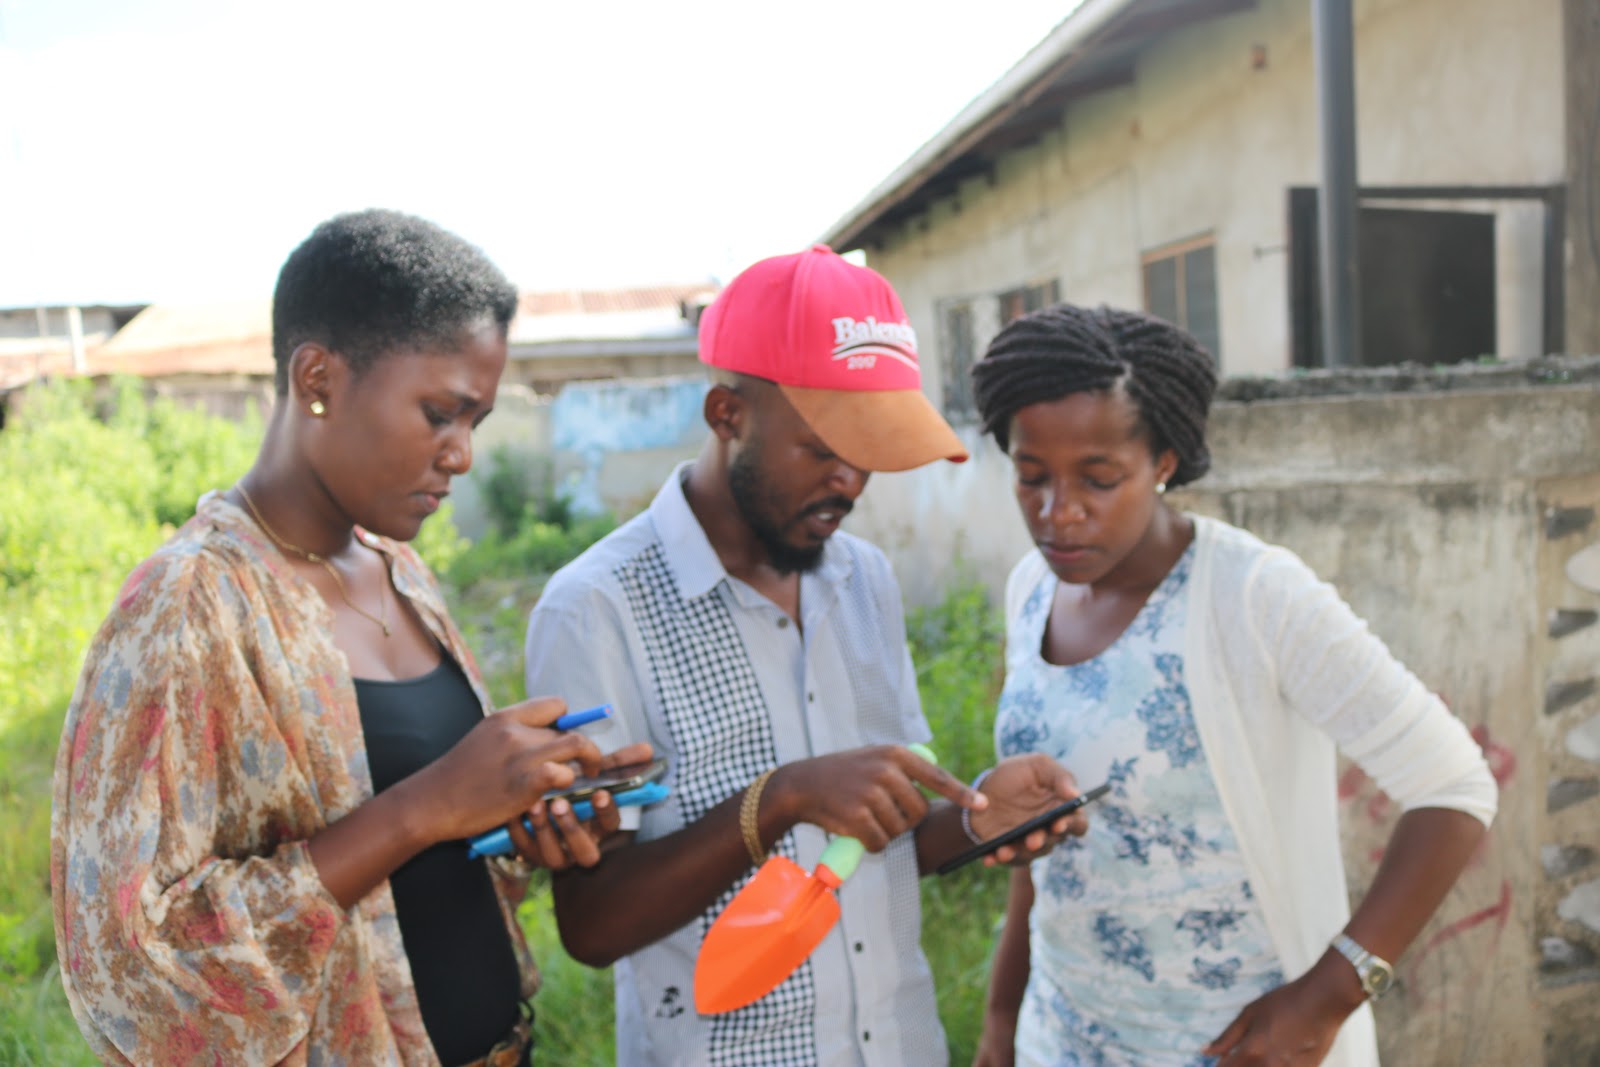
Our partner, JBA Consulting, created 731 sample points on a map using a 2km by 2km regular grid to make sure we get samples for the whole of the Dar es Salaam catchment area. A team of 12 field mappers was then trained in the data collection, with an offset policy in place for points where a sample could not be taken due to inaccessibility. Each sample site had its unique code to identify it, date of sample collection and the name of the mapper to avoid any inconvenience that might occur during the analysis.
In case the sample point was hard to reach or a sample could not be collected for some reasons like paved areas, the mapper had to move about 500 meters north and collect the sample. In order to reach the points for taking the soil samples, mappers were used MapHub on their phone to guide them. When connectivity became an issue the team switched to the Maps.Me application, which allowed them to navigate to points offline simply relying on the GPS on their phones.
When collecting samples in the field, a mapper needed to take two samples; top sediment at the depth between 3cm -7cm and the bottom sample between 7cm -15cm. When in the field, a mapper would fill out an Open Data Kit survey form about the collected soil sample and take a picture of the surrounding environment.
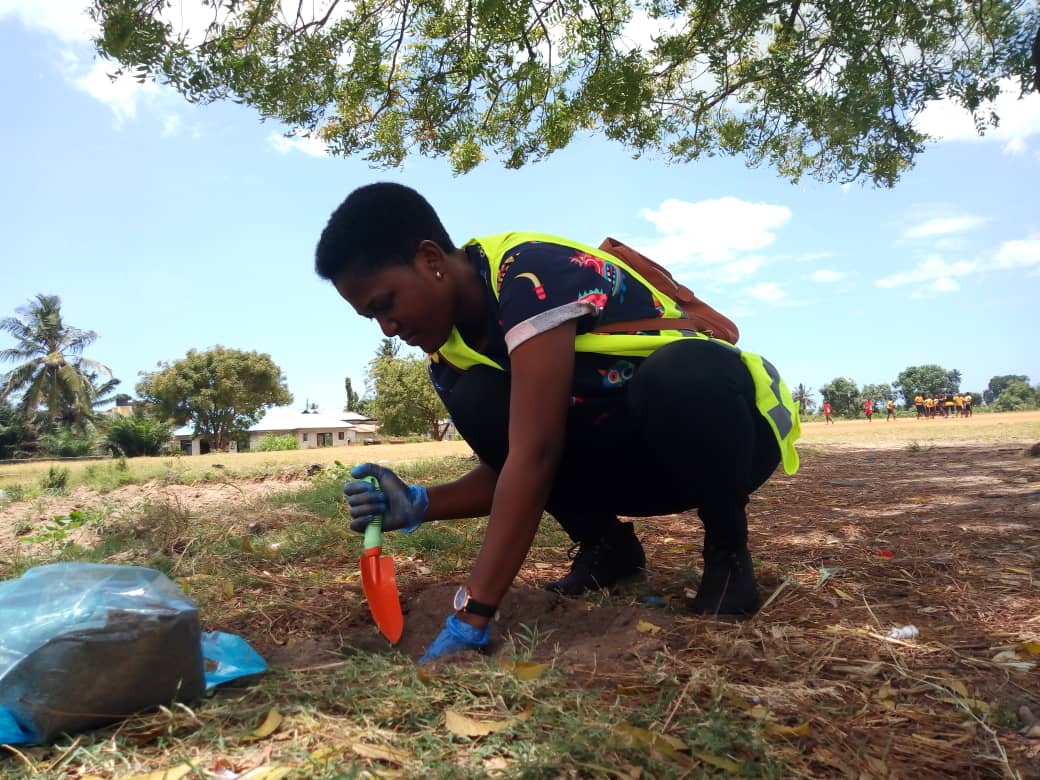
The ODK form had questions to be filled with mappers when they were at the site. The questions included:
The name of the region where the sample was collected, district name, ward name, subward name, the ID number of the sample and also the mapper was supposed to take photos before, during, and after collecting the soil sample.
Analysis of Sediments
The collected sediments were then sieved to determine grain size distribution. Before sieving, the sample is supposed to weigh 500g, and after sieving, the mass of the soil was recorded on a spreadsheet according to the layers of the sieving tool. There was also a prepared ODK form which was being used to fill in the sieved data to make sure that the data is safe in a server.
Outcomes and Impact
Now that we have soil data of the city and the drainage data is underway to be completed, we will then be able to create an accurate flood model of the city by layering the sediment data and drainage channels data of the city and obtain a more complete understanding of flooding in Dar es Salaam.
Apart from having data on soil characteristics on the city, Our team have learned a lot and increased their level of expertise as they fully participated in sample analysis which is normally done by professionals. The commitment of our team and eagerness to learn new thing is among the best outcome of this activity.
What is next on the RH 2.0 project?
As the next phase of Ramani Huria 2.0 is expected to end in July this year, in the coming month we expect to go back to the community and share back the data that we have been collecting over the past months. A number of “shareback” sessions will be conducted and we will build the capacity of local leaders and NGOs on the specific subwards/ wards to make sure they are able to use data collected for different developmental activities.